Feature

Analytics That Reveal How Your Studio Really Operates

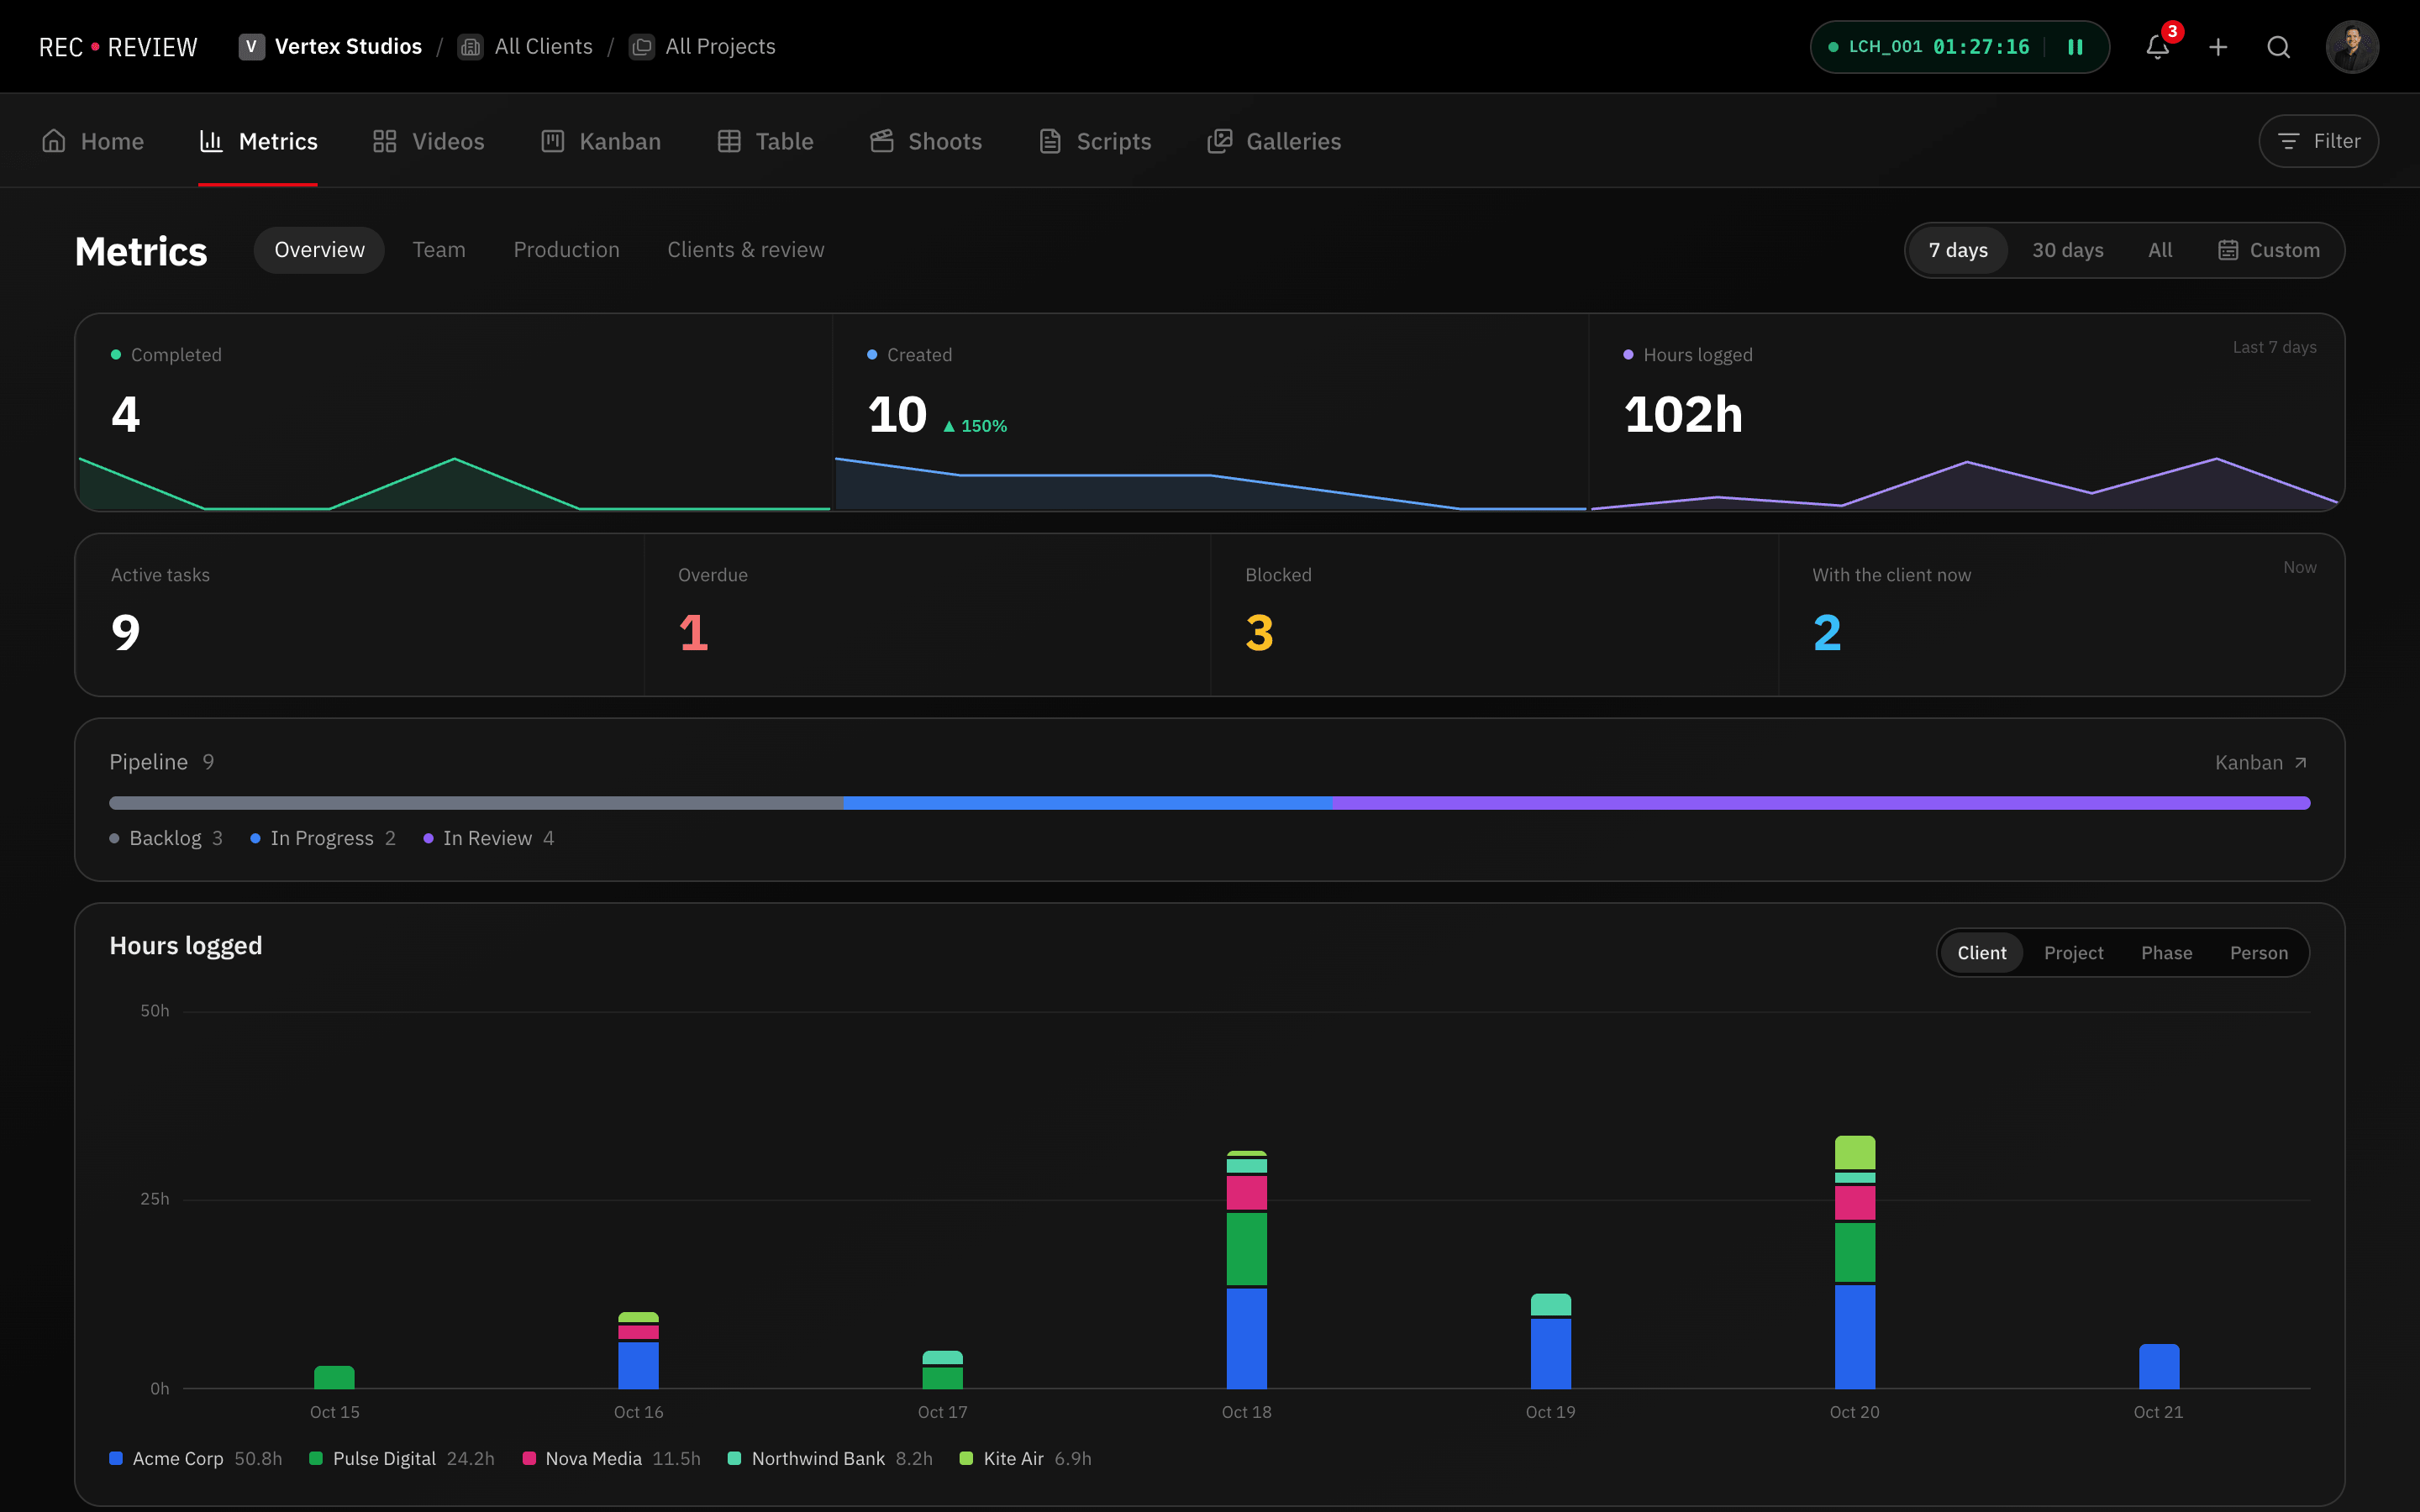
Most production teams operate on gut feeling: projects take "about two weeks," revisions are "usually two rounds," and the team is "pretty busy." RecReview replaces guesswork with data, giving you concrete metrics on project timelines, team utilization, and production efficiency.

Project Timeline Analytics

Track how long projects take from creation to delivery. See average timelines by project type, client, or team member. Identify bottlenecks where projects consistently stall, whether it is a slow review phase, a backed-up editor, or a client who takes weeks to respond.

Timeline data helps you set realistic expectations for new projects. Instead of guessing that a project will take two weeks, you can reference historical data showing that similar projects averaged 11 days with a standard deviation you can plan around.

Break timelines down by phase to see where time is actually spent. Use time tracking data alongside timeline analytics to pinpoint exactly where hours go. If post-production consistently takes three times longer than pre-production, you know where to invest in process improvements or additional resources.

Team Utilization and Workload

See how time is distributed across your team. Identify who is overloaded and who has capacity. Understand how much of your team's time goes to creative work versus revisions versus administrative tasks.

Utilization data is essential for studios that need to decide whether to hire, outsource, or restructure workflows. Combine it with project management views for a complete operational picture. Without it, you are making staffing decisions based on who complains the loudest about being busy rather than on actual workload data.

Revision and Feedback Metrics

Track how many revision rounds projects typically require. See which clients request the most changes. Understand whether revision counts are trending up or down over time. This data helps you identify systemic issues in your briefing process, creative direction, or client communication.

Comment resolution rates show how efficiently your team addresses feedback. A high volume of comments that stay open for days suggests a process bottleneck. Quick resolution rates indicate a healthy review workflow. These metrics make the invisible parts of your production process visible.

Delivery and Completion Tracking

Monitor delivery rates, on-time completion percentages, and client response times. These metrics are the outcomes that matter most: are you delivering on time, and are your clients satisfied?

Historical delivery data helps you identify seasonal patterns, capacity constraints, and the true cost of scope changes. When you can show a client that their additional revision requests added four days to the timeline, the conversation about deadlines becomes grounded in data rather than frustration.

See it in action

Start your free trial and experience it yourself.

Start 15-Day Free Trial →

No credit card required

Frequently Asked Questions

What data does RecReview track?
RecReview tracks project timelines, task status changes, phase transitions, time entries, comments and resolutions, version uploads, review statuses, and delivery events. This data is aggregated into dashboards and reports.
Can I export analytics data?
Analytics data can be exported for use in external reporting tools. Time entries, project timelines, and delivery metrics are available through the platform.
How far back does historical data go?
All data from the creation of your workspace is retained and available for analysis. There is no rolling window or data expiration. Your analytics improve over time as more historical data accumulates.
Explore More

Related Features

Try it free for 15 days

No credit card required. Full access to all features.

Start Free Trial →